At the 10th World Glaucoma Association Consensus Meeting, a large group of representative glaucoma clinicians and scientists discussed the clinical criteria and technologies for the diagnosis of glaucoma and reached a consensus that the clinical diagnosis of glaucoma rests on the detection of a thinned retinal nerve fiber layer (RNFL) and narrowed neuroretinal rim.1 The RNFL contains the unmyelinated axons of retinal ganglion cells, and the examination of the RNFL in current clinical practice is contingent on OCT measurement of parapapillary RNFL thickness.2 An RNFL thickness value below the fifth or the first percentile reference value is indicative of an RNFL abnormality.
False positives and false negatives, however, are common in OCT reports. For example, in highly myopic eyes, the superotemporal and inferotemporal RNFL bundles typically converge toward the macula, which renders RNFL thickness measurements at the superior and inferior quadrants of the optic disc relatively abnormal compared with those for eyes that have no or low to moderate myopia. The specificity of OCT has been shown to be as low as 30% for the detection of RNFL defects in highly myopic eyes with glaucoma.3 Along these lines, focal RNFL defects in early glaucoma can be missed with conventional OCT RNFL thickness analysis because the built-in normative data fail to capture the unique fingerprint of RNFL thickness distribution for an individual eye. The fact that the borders of RNFL defects, as revealed with OCT topographic analysis of RNFL thickness, are rarely confined to the expected trajectories of axonal fiber bundles has complicated the distinction between false positives and genuine RNFL defects.
VISUALIZATION OF THE AXONAL FIBER BUNDLES WITH RNFL optical texture analysis
The clinical visualization of individual axons of retinal ganglion cells is not yet possible. The trajectories of axonal fiber bundles (each of which has been estimated to contain approximately 300 to 20,000 individual axons4), however, can sometimes be revealed with red-free photography, most often over the superotemporal and inferotemporal vascular arcades where the density of axonal fiber bundles is high. Uncovering these axonal fiber bundles becomes problematic over the macula and the peripheral retina where the RNFL is thin and RNFL scattering is weak.
My colleagues and I recently devised RNFL Optical Texture Analysis (ROTA), an algorithm to uncover the optical texture and trajectories of individual axonal fiber bundles over a wide field, including the optic nerve head region and the macula (Figure 1).5,6 ROTA integrates RNFL thickness and RNFL reflectance measurements obtained from a standard OCT scan to augment the signal contrast of axonal fiber bundles encased in the RNFL via a series of nonlinear transformation.
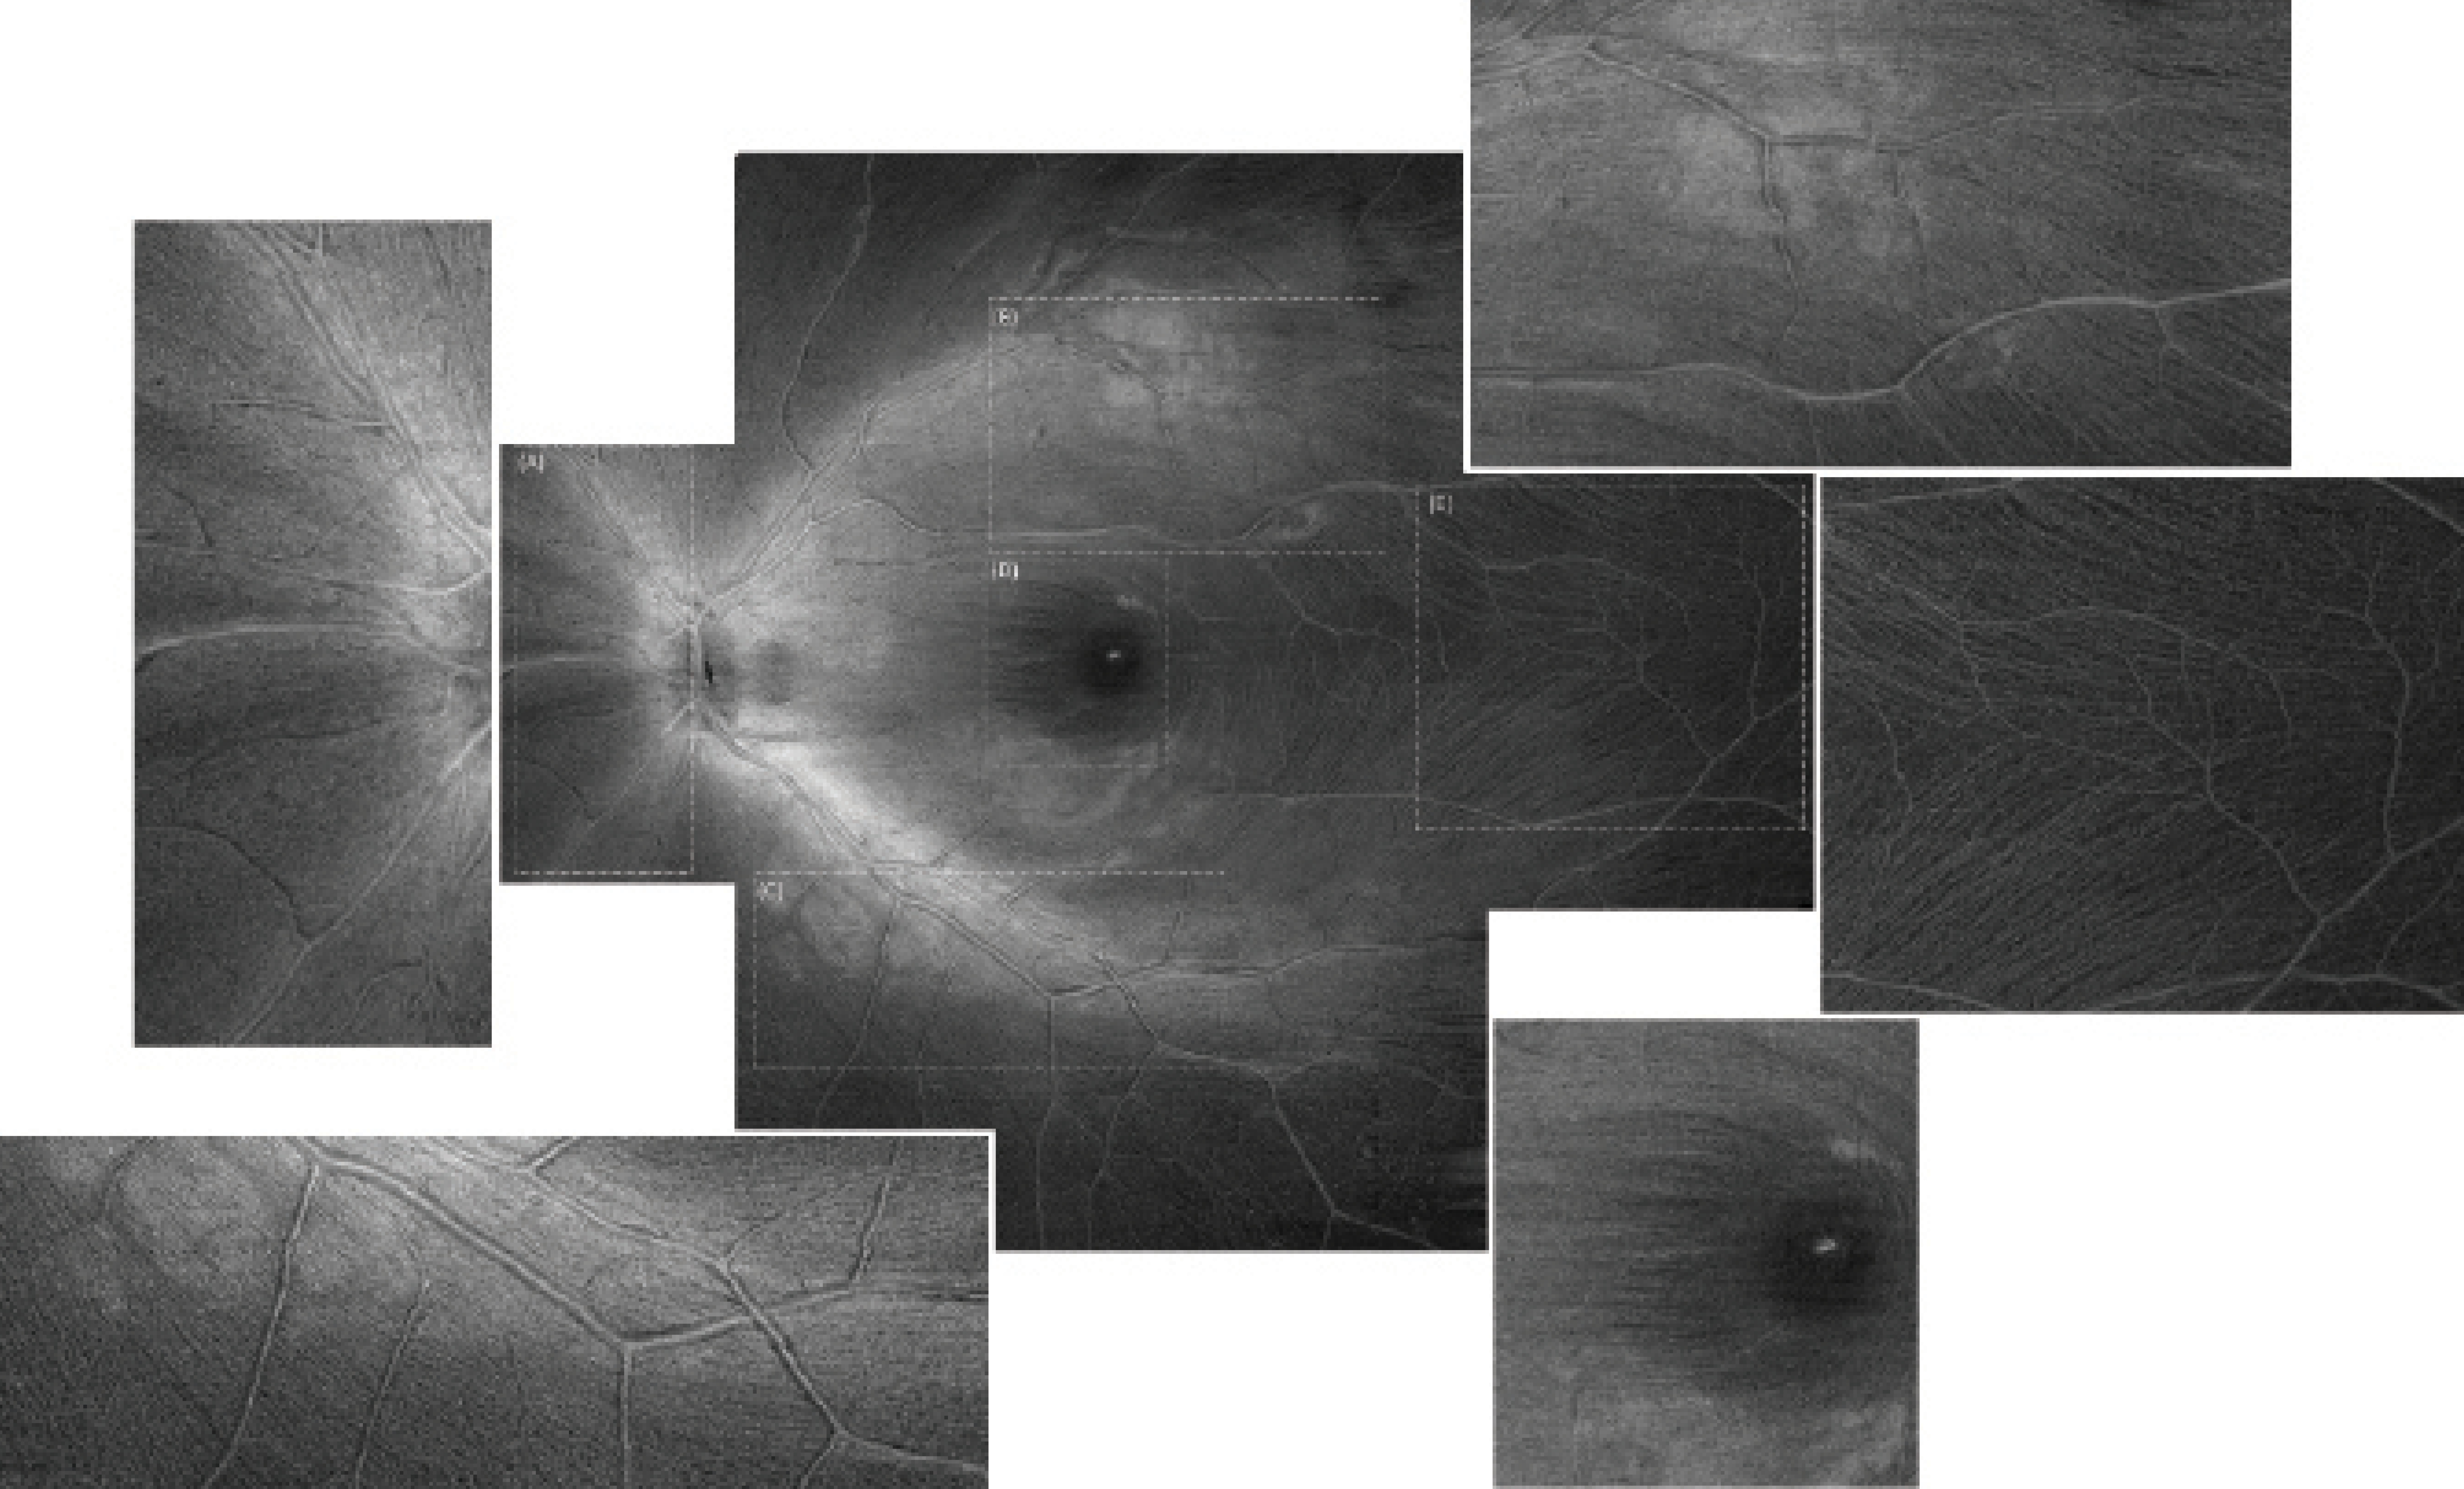
Figure 1. ROTA uncovers the nasal radial bundles (A), the superior arcuate bundles (B), the inferior arcuate bundles (C), and the papillomacular bundles (D). Individual axonal fiber bundles are visible over the macular raphe where their density is low (E). Magnified views are shown on the sides. The ROTA montage is composed of nine OCT raster scans, each with 512 x 512 pixels, covering a retinal field of approximately 70º to 80º. Adapted with permission from Leung et al.6
Unlike red-free photography and en face OCT in which the visualization of axonal fiber bundles is typically confined to limited regions of the retina, ROTA enables the visualization of arcuate bundles proximal and distal to the optic disc as well as the papillomacular bundle and the radial nasal bundle (Figure 1). The performance of ROTA has been robust in eyes with moderate media opacities and a hypopigmented fundus for which red-free photography failed to show the RNFL. In a recent study, we reported that, whereas 48.5% of eyes (160 out of 330 eyes) had suboptimal RNFL visibility in red-free photographs, only 2.4% (8 eyes) had suboptimal RNFL visibility in ROTA.6 Furthermore, ROTA attained a higher sensitivity and specificity to detect glaucoma compared with topographic OCT analysis of the RNFL thickness and ganglion cell inner plexiform layer (GCIPL) thickness, with perimetry or red-free photography used as the reference standard.6 Because it is able to follow the trajectories of axonal fiber bundles, ROTA can increase diagnostic precision to identify RNFL defects.
HOW CAN ROTA IMPROVE THE DETECTION OF RNFL DEFECTS IN GLAUCOMA?
ROTA can help to identify the extent and pattern of RNFL defects in early and advanced glaucoma. In eyes with early glaucoma, ROTA can reveal focal RNFL defects missed by red-free photography and OCT RNFL/GCIPL thickness analysis (Figure 2). In eyes with advanced disease, for which OCT RNFL/GCIPL thickness analysis is no longer useful to determine the severity of RNFL damage because of a floor effect, ROTA can detect different degrees of papillomacular bundle loss (Figure 3). Collectively, ROTA represents an intuitive paradigm that can empower specialists and nonspecialists to identify RNFL abnormalities in glaucoma.
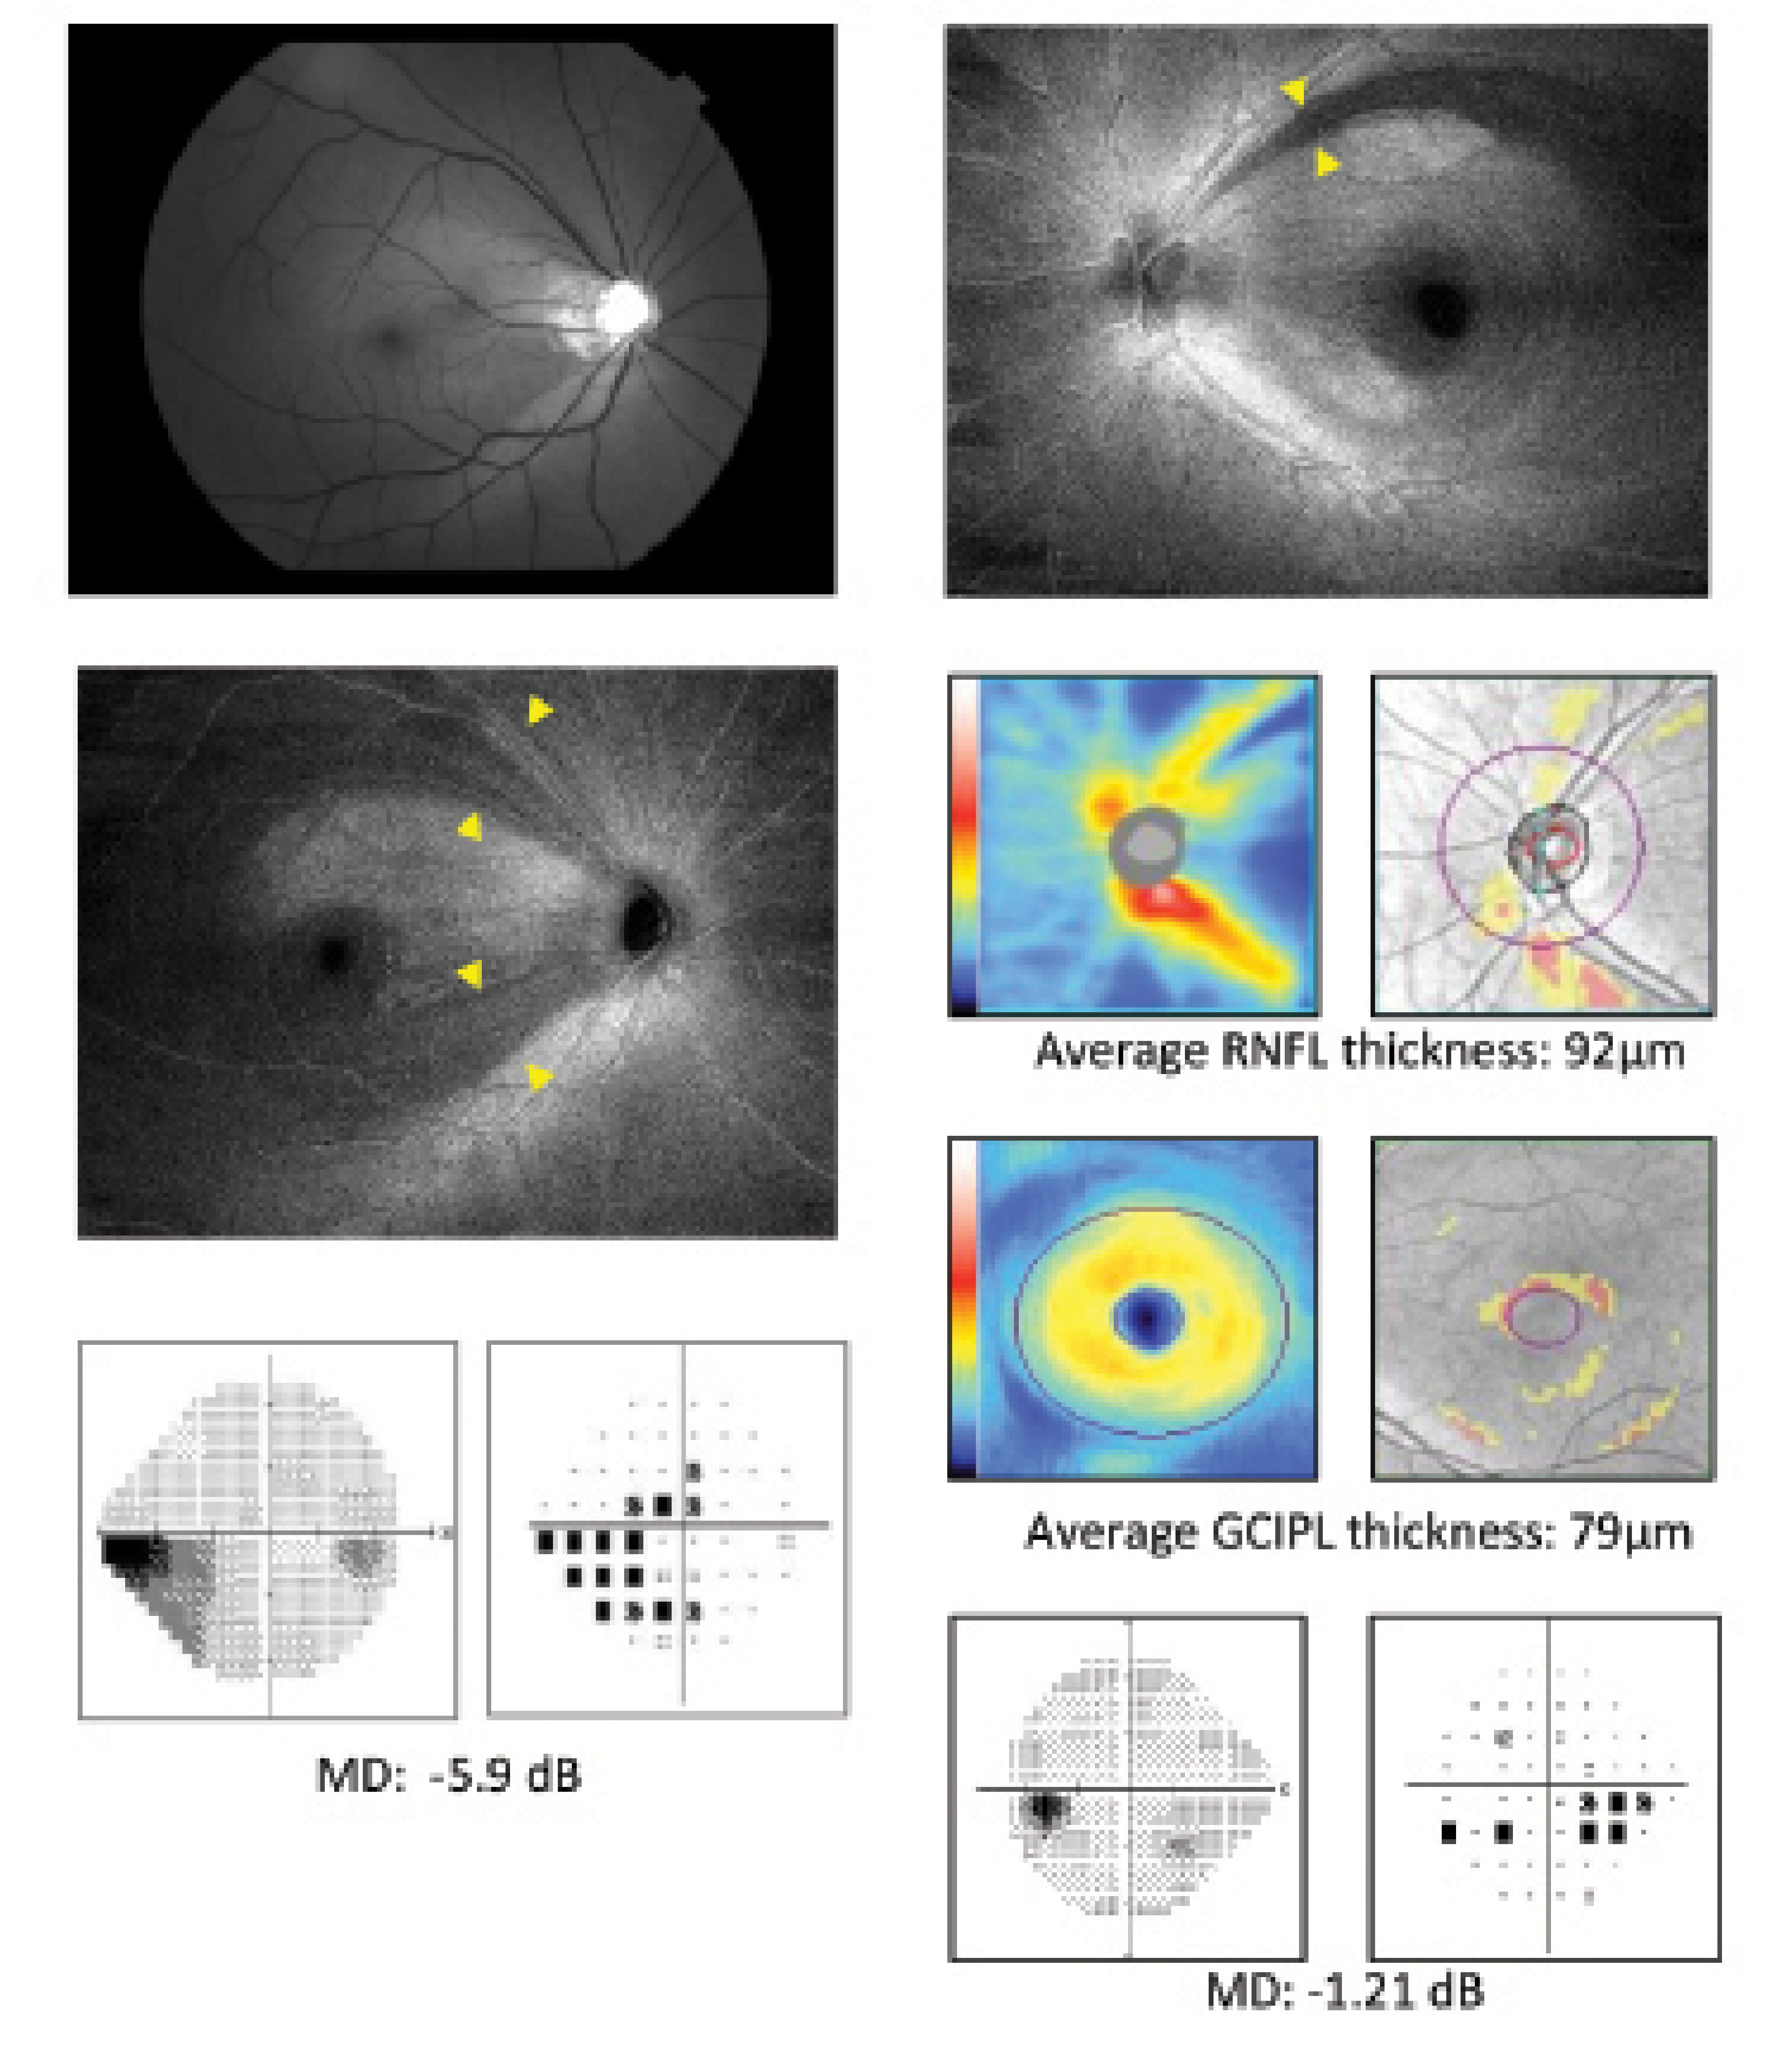
Figure 2. RNFL defects in early glaucoma missed by red-free photography (A) and OCT RNFL/GCIPL thickness analysis (B) are detected in ROTA (9 x 12 mm2, 512 x 512 pixels). Modified from Leung et al.6
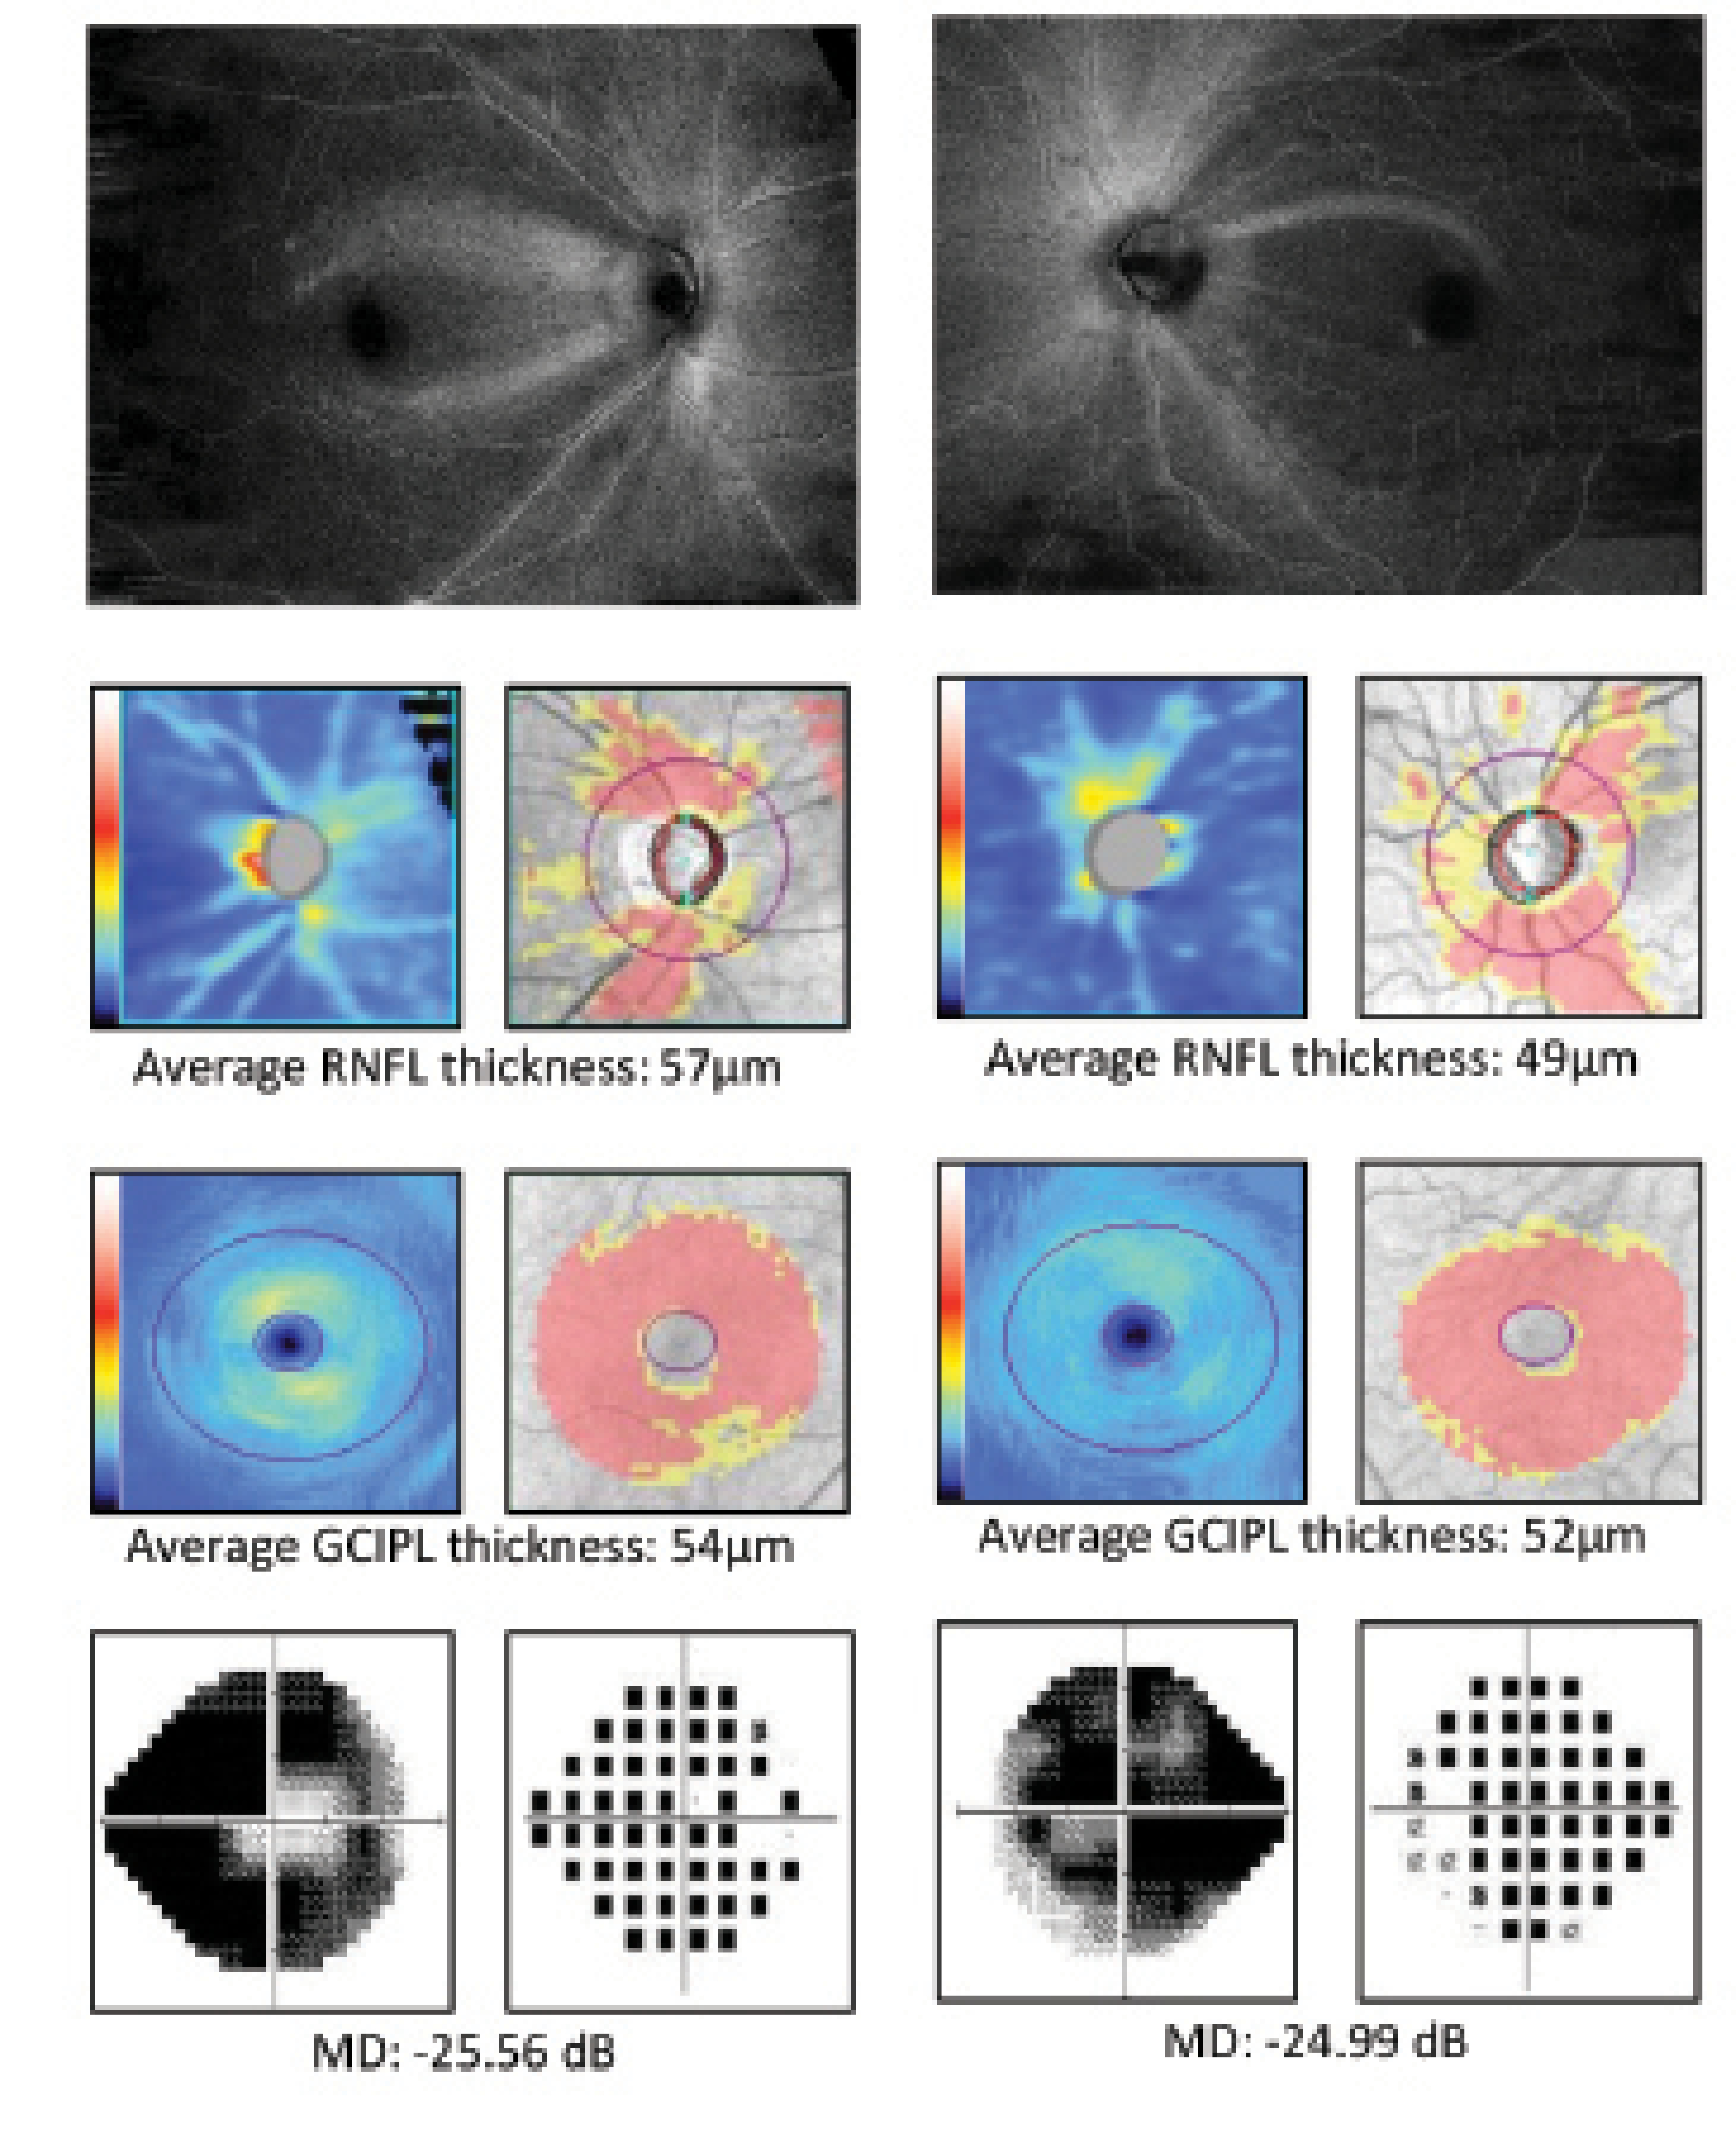
Figure 3. ROTA detects the patterns and severity of axonal fiber bundle loss at the macula in an eye with advanced glaucoma. Whereas a similar degree and pattern of RNFL and GCIPL thickness abnormalities are shown with conventional OCT RNFL/GCIPL thickness analysis (A, B), ROTA reveals more extensive involvement of the papillomacular bundle (B). Modified from Leung et al.6
LIMITATIONS AND FUTURE PERSPECTIVES
The image quality of ROTA—like conventional OCT scans—can be compromised in eyes with dense media opacities, a low signal-to-noise ratio, or motion artifacts. As with red-free RNFL photography, the detection of RNFL defects using ROTA is largely subjective, but it is feasible to measure the area and the angular width of RNFL defects. We found that the interobserver agreement for the detection of RNFL defects among glaucoma specialists and residents was high; the test-retest variability of ROTA assessment was low; and, more importantly, the ROTA-based assessment of RNFL defects outperformed OCT RNFL/GCIPL thickness analysis with RNFL/GCIPL defects defined with reference to the normative distribution of RNFL/GCIPL thickness.6 With high-density raster scans, ROTA can detect fine details of axonal fiber bundles (Figure 4). ROTA can also play an important role in determining the involvement of the papillomacular and papillofoveal bundles in early glaucoma7 and identifying different patterns of RNFL defects in nonglaucomatous optic neuropathies.6 We are currently working with several members of industry to deploy ROTA in clinical care, and we hope that the paradigm facilitates the early detection of glaucoma to avert its progression.
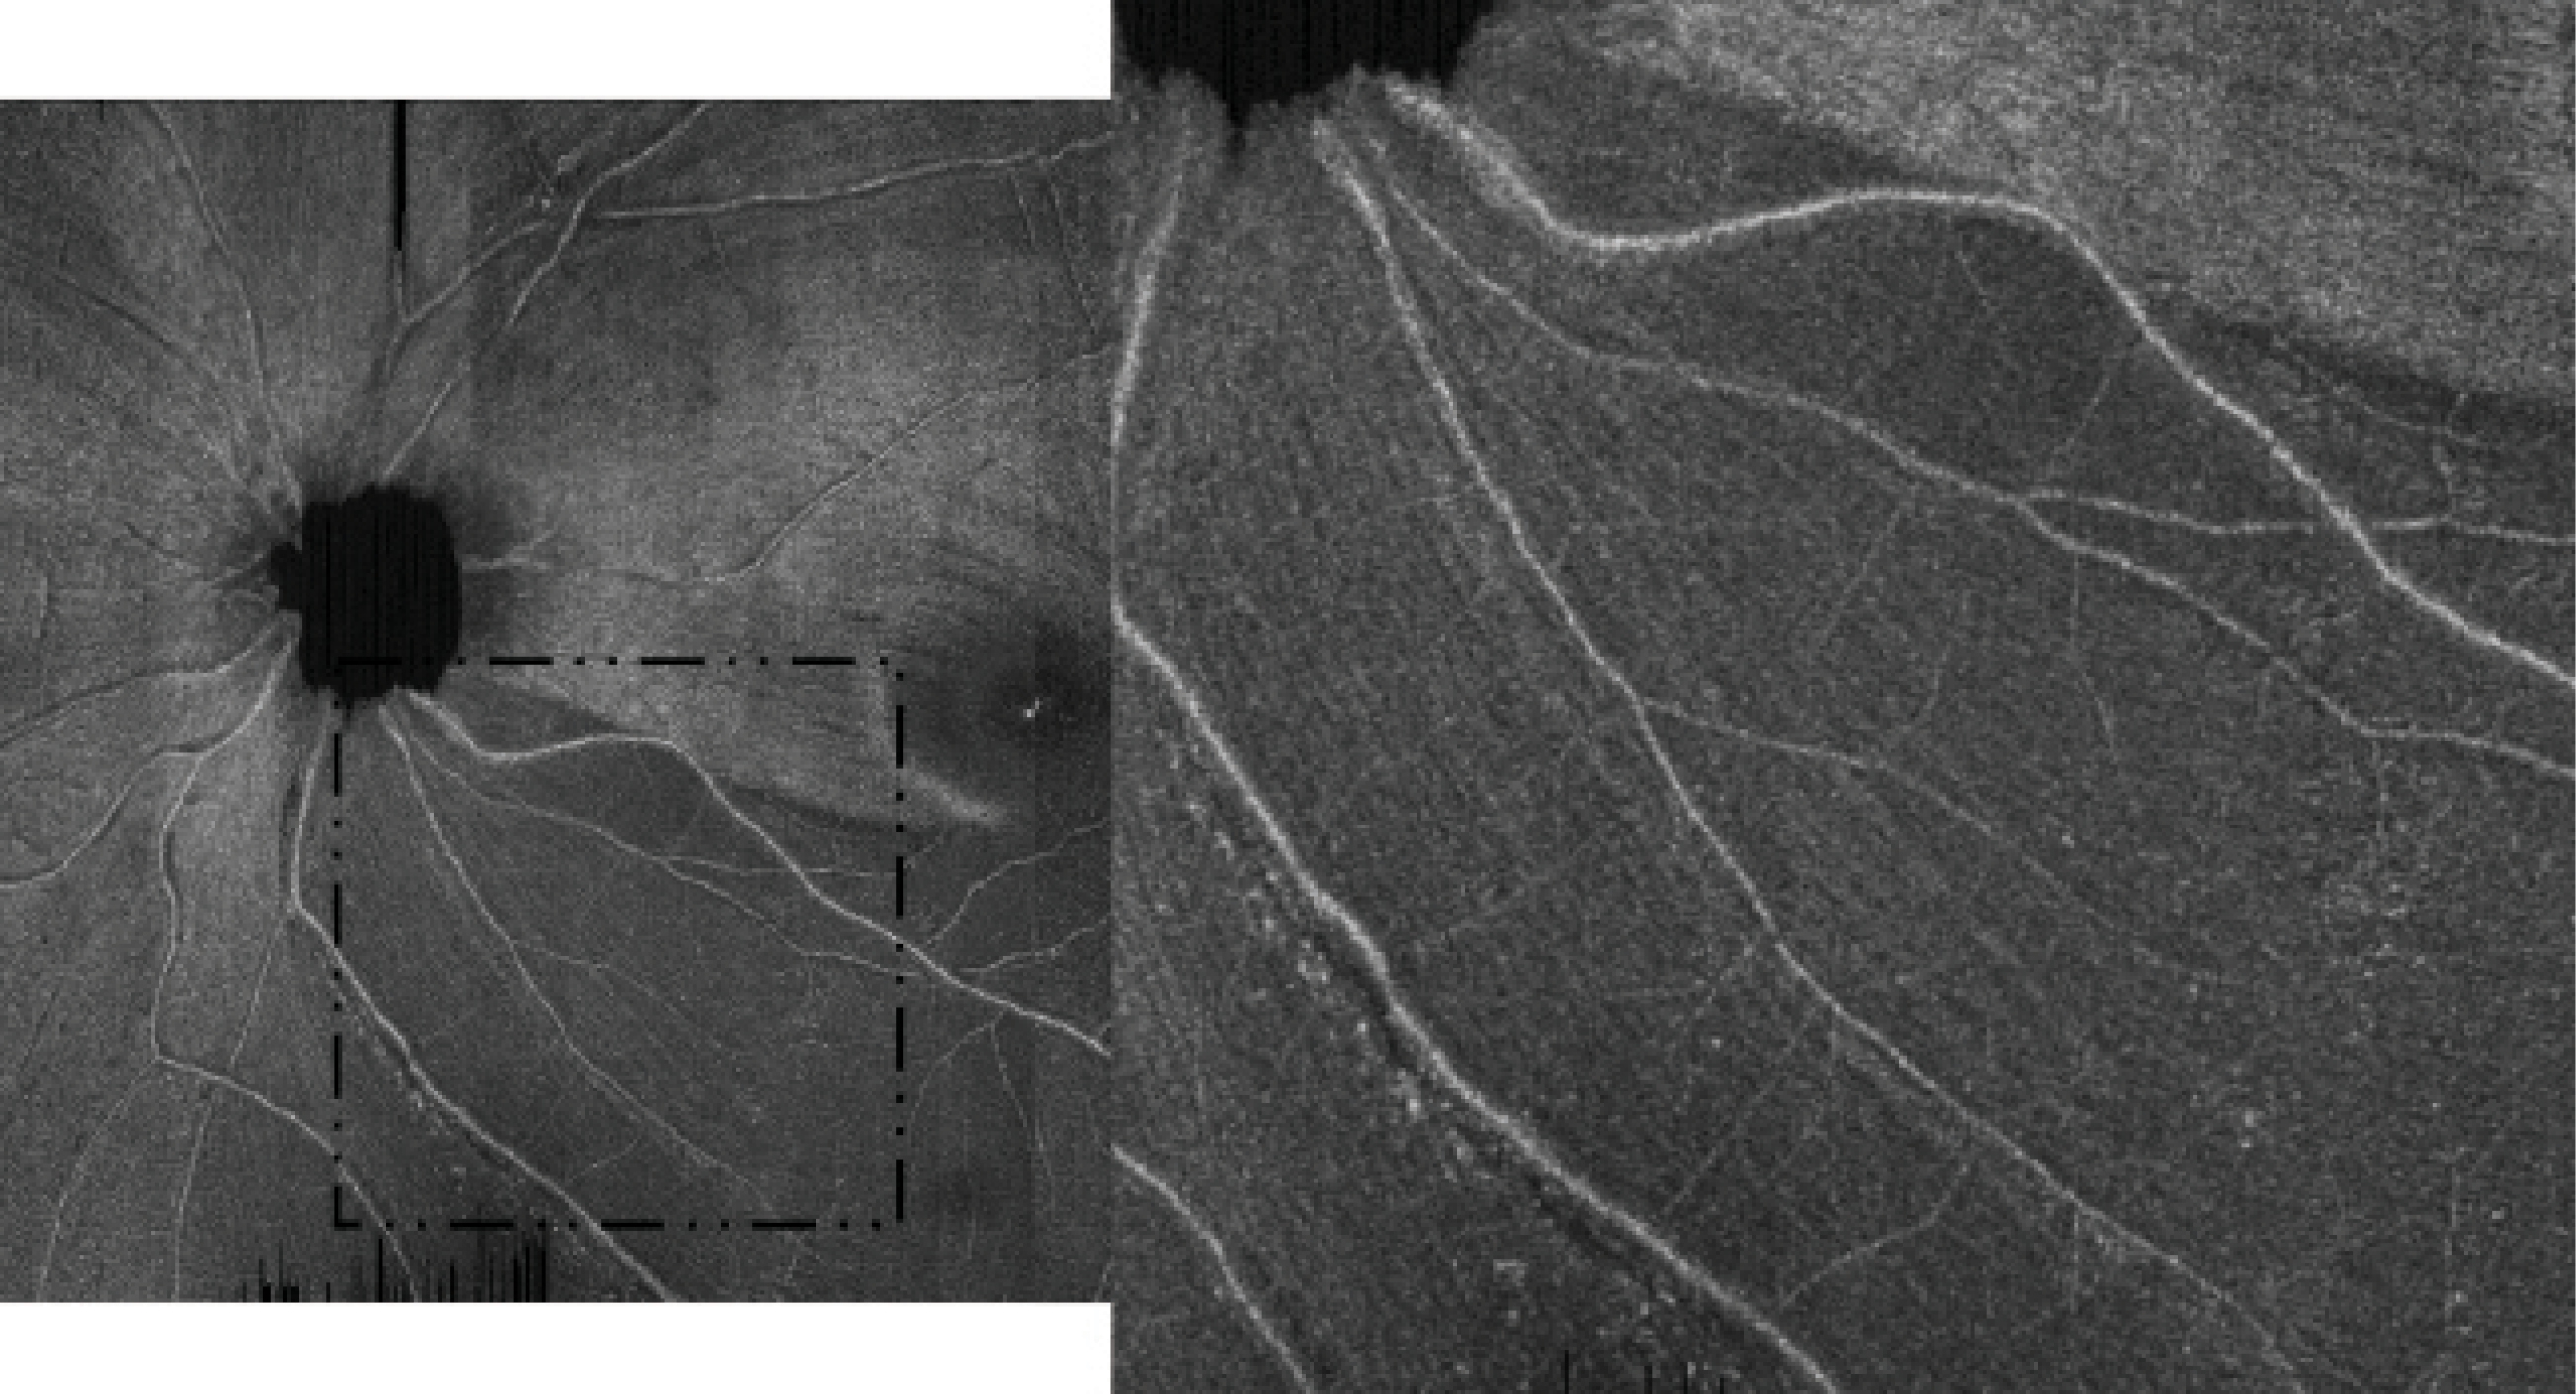
Figure 4. A high-density raster ROTA scan (28º x 30º with 1536 x 729 pixels) shows residual axonal fiber bundles over an inferotemporal RNFL defect. Adapted with permission from Leung et al.6
This research was supported by Hong Kong Research Grants Council General Research Fund 14101518, 14101117, 14100916, 14101215. The funder had no role in the initiation or design of the study, collection of samples, analysis, interpretation of data, writing of the article, or its submission for publication. The study and researchers are independent of the funder.
1. Weinreb RN, Garway-Heath DF, Leung C, Medeiros FA, Liebmann J. WGA Consensus Series 10: Diagnosis of Primary Open Angle Glaucoma. Kugler Publications; 2017.
2. Weinreb RN, Leung CK, Crowston JG, et al. Primary open-angle glaucoma. Nat Rev Dis Primers. 2016;2:16067.
3. Biswas S, Lin C, Leung CK. Evaluation of a myopic normative database for analysis of retinal nerve fiber layer thickness. JAMA Ophthalmol. 2016;134(9):1032-11039.
4. Sugita M, Pircher M, Zotter S, et al. Retinal nerve fiber bundle tracing and analysis in human eye by polarization sensitive OCT. Biomed Opt Express. 2015;6(3):1030-1054.
5. Leung CK, Lam AK, inventor; The Chinese University of Hong Kong, assignee. Optical texture analysis of the inner retina. US patent 10,918,275. February 16, 2021.
6. Leung CKS, Lam AKN, Weinreb RN, et al. Diagnostic assessment of glaucoma and non-glaucomatous optic neuropathies via optical texture analysis of the retinal nerve fibre layer. Nat Biomed Eng. 2022;6(5):593-604.
7. Leung CKS, Guo PY, Lam AKN. Retinal nerve fiber layer optical texture analysis (ROTA): involvement of the papillomacular bundle and papillofoveal bundle in early glaucoma. Ophthalmology. Published online April 22, 2022. doi:10.1016/j.ophtha.2022.04.012